Vector
What is a vector?
A geometric object that has magnitude (or length) and direction
Collection of variables!!
Vector only cares about the "difference" between the starting point and the end point

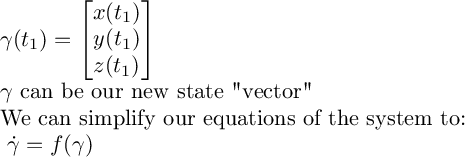
Why we need it here?
=> We can use vector to describe current variables!!!
How to create vector in Sage
'how we define vectors'
(1, 2)
(3, -3)
'math operation on vectors'
(4, -1)
(3, 6)
(1, -1)
'retrieve each variable'
1
-3
How to plot them?

We can also plot in 3D
3D rendering not yet implemented
Linear Function
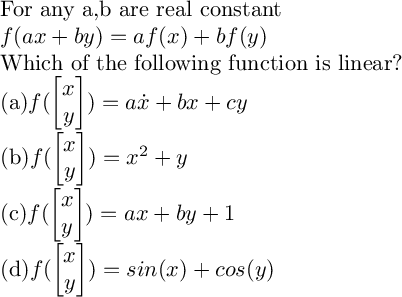
Answer: (a)

Hint for today's lab
In today's lab, it requires you to write a function for determining whether a function is linear
Hint: Compare two symbolic equations
