Data Analysis for Doughnut Economics
Celebrating the Doughnut. This worksheet is a calculation on U.S. National Doughnut Day, June 1, 2018, inspired by Kate Raworth's Doughnut Economics

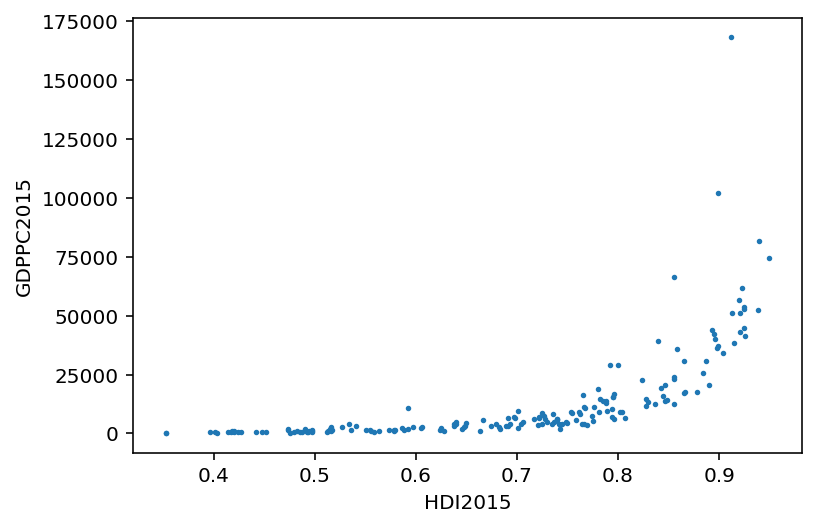
We download tables of Gross Domestic Product (GDP) per capita and Human Development Index (HDI) for the countries of the world and observe the discrepancy in the rankings.
There are more advanced visualizations Human Development Index (HDI) and related information. For example, see Our World in Data HDI.
The purpose of this worksheet is to demonstrate basic access to the wealth of online data using open-source programming tools (Python, pandas), and to get a bit of a start at coding to explore the ideas of doughnut economics.
Disclaimer: I am not an economist. (In case it wasn't obvious.)
Feedback to Hal Snyder, [email protected]
Links
Kate Raworth's blog posting: Want to know how to get beyond GDP? Start here.
Why we might be interested in other measures of progress than GDP: Beyond GDP: The Need for New Measures of Progress from 2009.
Source for .xlsx file of HDI for 2015 is UN Development Programme Human Development Data (1990-2015).
Source for .csv file of GDP Per Capita in current USD for 2015 is at UN data Per capita GDP at current prices - US dollars.
| country | HDI2015 | |
|---|---|---|
| 0 | Norway | 0.949423 |
| 1 | Australia | 0.938680 |
| 2 | Switzerland | 0.939131 |
| country | GDPPC2015 | |
|---|---|---|
| 0 | Afghanistan | 610.854517 |
| 1 | Albania | 3877.487975 |
| 2 | Algeria | 4160.218690 |
| HDI_rank | GDP_rank | |
|---|---|---|
| country | ||
| Norway | 1.0 | 4.0 |
| Australia | 3.0 | 10.0 |
| Switzerland | 2.0 | 3.0 |
| HDI2015 | GDPPC2015 | HDI_rank | GDP_rank | |
|---|---|---|---|---|
| country | ||||
| Afghanistan | 0.479375 | 610.854517 | 161.0 | 167.0 |
| Albania | 0.764174 | 3877.487975 | 71.0 | 107.0 |
| Algeria | 0.744806 | 4160.218690 | 79.0 | 97.0 |
| HDI2015 | GDPPC2015 | HDI_rank | GDP_rank | |
|---|---|---|---|---|
| country | ||||
| Norway | 0.949423 | 74360.641259 | 1.0 | 4.0 |
| Switzerland | 0.939131 | 81647.599454 | 2.0 | 3.0 |
| Australia | 0.938680 | 52237.928546 | 3.0 | 10.0 |
| Germany | 0.925669 | 41313.210675 | 4.0 | 17.0 |
| Singapore | 0.924866 | 53626.243222 | 5.0 | 8.0 |
| Denmark | 0.924649 | 52964.425912 | 6.0 | 9.0 |
| Netherlands | 0.924312 | 44750.095821 | 7.0 | 13.0 |
| Ireland | 0.922746 | 61831.997993 | 8.0 | 6.0 |
| Iceland | 0.921110 | 51241.827451 | 9.0 | 11.0 |
| Canada | 0.920284 | 43193.886549 | 10.0 | 15.0 |
| United States | 0.919553 | 56639.769525 | 11.0 | 7.0 |
| New Zealand | 0.914900 | 38491.649589 | 12.0 | 20.0 |
| Sweden | 0.912706 | 50997.572024 | 13.0 | 12.0 |
| Liechtenstein | 0.911517 | 168177.258828 | 14.0 | 1.0 |
| Japan | 0.903462 | 34224.423817 | 15.0 | 24.0 |