Pre-Calculus and Trigonometry Review
This tutorial requires a working knowledge of functions and graphs. When we refer to , we are referring to a function whose values may change as x changes. For example, in this function:
is equal to times . We can evaluate the function when is equal to ___ by replacing all occurrences of with ___, then simplifying the resulting expression:
and
To plot this function, we sketch a set of axes:

Then we evaluate for a couple values of x (also known as a table of values) and plot the results according to their x-value -- moving along the horizontal x-axis -- and their y-value -- moving along the vertical y-axis -- and draw a line between them, like so:

As you can see, the graph intersects the x- and the y-axes at and , respectively. To find the x-intercepts (if any) of a function , replace with zero and solve for . For example:
Thus, has x-intercepts at and . Finding the function's y-intercept is easy; simply replace with :
Since a function can have at most one output for every input, a function can have at most one y-intercept. Conversely, since a function can have any number of inputs for one output, a function can have any number of x-intercepts.
Transformations
Given a function , if
then will be:
- stretched vertically by a factor of
- compressed horizontally by a factor of
- displaced horizontally to the right by units
- displaced vertically upward by units
- If is negative, will be inverted over the y-axis
- If n is negative, will be inverted over the x-axis
- The sign of and affects the direction of the function's displacement.
To apply this, try manipulating the function . If you have the SageMath notebook open, start a new worksheet and copy the following code into the first cell. Manipulate , , , and (and/or itself), then evaluate the code to see how the graph changes.

Trigonometry
Trigonometry is the math of triangles -- or as you have probably experienced, the math of triangles inscribed in circles. The following images from Wikipedia are visual representations of the trigonometric functions and the unit circle, respectively.
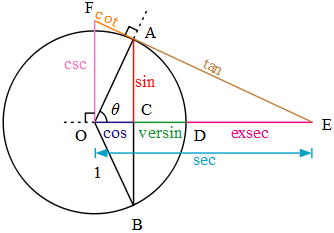
This calculus tutorial requires no knowledge of versin or exsec, but you should be familiar with cosine, sine, and tangent, and have passing knowledge of cosecant, secant, and cotangent. Remember SOHCAHTOA (pronounced 'soak-uh-toe-uh'): sine is Opposite over Hypotenuse, Cosine is Adjacent over Hypotenuse, and Tangent is Opposite over Adjacent.
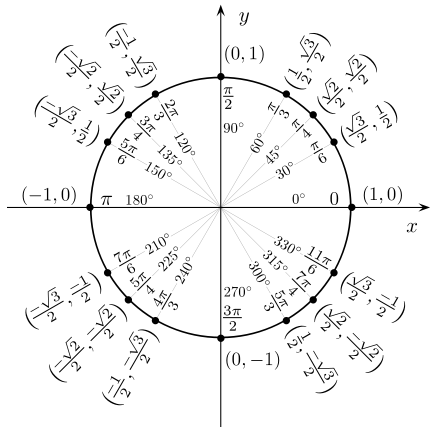
In the pictured unit circle, the coordinate pairs describe the cosine of the angle (comma) the sine of the angle. It shows that the cosine of is , while the sine of is , and so forth. The units involving are known as radians: one would say, 'an angle of three pi over two radians', which is also equivalent to two hundred seventy degrees.
For this or any exploration of calculus, there are some basic trigonometric identities with which you should be familiar. In approximate order of importance, they are:
To refresh your memory, here are some graphs of trigonometric functions:


The period of sine, cosine, secant, and cosecant is , while the period of tangent and cotangent is . A function's period is the horizontal width of its repeating section. Since the sine function has a period of , the interval is identical to . Similarly, sine's interval is identical to .
Well, that's it for the review. I tried to keep it fairly straightforward, but if there is something you would like added/clarified, please let me know. That aside, it's time to go forth and learn some calculus!