| Download
Asymptote graphics package demo in sage worksheet
Project: 📚 MOOC Companion
Path: Public/asy-demo.sagews
Views: 617Asymptote Vector Graphics Language in a Sage worksheet
How-to:
asymptote calculation in a single cell of a .sagews file
  %asy
  ... asymptote commands
have all cells in a Sage worksheet %asy mode by default:
  %auto
  %default_mode asy
Tutorials and Examples
Extensive 109-page tutorial by Charles Staats III An Asymptote tutorial.
873 examples of Asymptote code Asymptote: The Vector Graphics Language
Asymptote References
Sourceforge: Asymptote: The Vector Graphics Language
GitHub: ASYMPTOTE
%auto
%default_mode asy
In the Staats tutorial, examples begin by setting output format to .pdf. Omit that setting below, because %asy mode in a worksheet uses png output.
// say hello
label("Hello default font");

// use larger and heavier font than the default
label("Hello 18pt Helvetica", p = fontsize(18pt)+Helvetica( "m" , "n" ), (150,0));

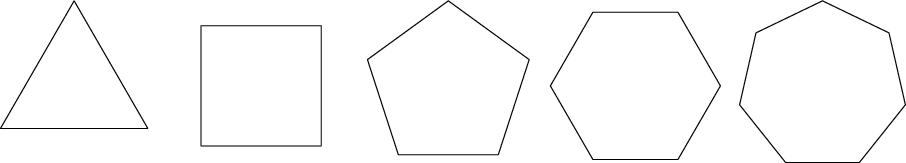
// https://math.uchicago.edu/~cstaats/Charles_Staats_III/Notes_and_papers_files/asymptote_tutorial.pdf, p.13
// polygons
unitsize(3cm);
defaultpen(1);
for (int n = 3; n <= 7; ++n) {
    draw(shift(2.2*n, 0) *
    polygon(n));
}
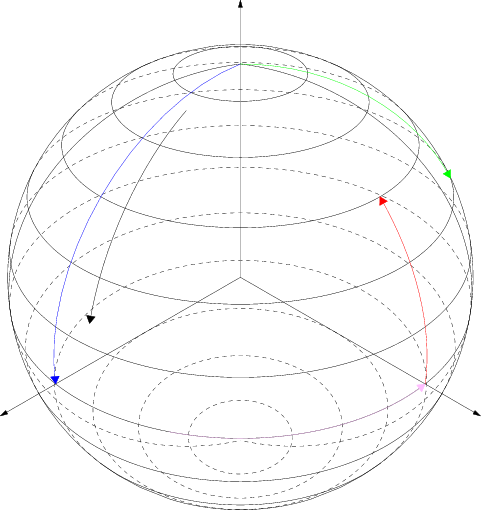
// spherial arcs
// https://tex.stackexchange.com/a/125819/148481
import solids;
import three;
settings.render=0;
settings.prc=false;
currentprojection=perspective(1,1,1);
size(18cm);

// distances: radius and length
real r=.4, ar=.5;

// sphere to visualize the various arcs
revolution S=sphere(O,r);
draw(S.silhouette(),black+linewidth(.5pt));
draw(S,black+linewidth(.5pt));

// axes
draw((0,0,0)--(0,ar,0),linewidth(0.5pt),Arrow3);
draw((0,0,0)--(0,0,ar),linewidth(0.5pt),Arrow3);
draw((0,0,0)--(ar,0,0),linewidth(0.5pt),Arrow3);

///////////////////////////////////////////////////////////
/////////////////////// blue arc //////////////////////////
///////////////////////////////////////////////////////////
// starting point in spherical coordinates
real theta=0, phi=0;
real x1=r*sin(theta)*cos(phi), y1=r*sin(theta)*sin(phi), z1=r*cos(theta);
// end point
real theta=pi/2, phi=0;
real x2=r*sin(theta)*cos(phi), y2=r*sin(theta)*sin(phi), z2=r*cos(theta);
draw(arc((0,0,0),(x1,y1,z1),(x2,y2,z2)),blue+linewidth(1pt),ArcArrow3);

///////////////////////////////////////////////////////////
////////////////////// green arc //////////////////////////
///////////////////////////////////////////////////////////
// starting point
real theta=0, phi=3*pi/4;
real x1=r*sin(theta)*cos(phi),y1=r*sin(theta)*sin(phi),z1=r*cos(theta);
// end point
real theta=pi/3, phi=3*pi/4;
real x2=r*sin(theta)*cos(phi), y2=r*sin(theta)*sin(phi),z2=r*cos(theta);
draw(arc((0,0,0),(x1,y1,z1),(x2,y2,z2)),green+linewidth(1pt),ArcArrow3);

///////////////////////////////////////////////////////////
/////////////////// other examples ////////////////////////
///////////////////////////////////////////////////////////
// arc(center,starting point,end point))
draw(arc((0,0,0),(0,r,0),(0,r*cos(pi/4),r*sin(pi/4))),red+linewidth(1pt),ArcArrow3);
// arc(center,radius,theta1,phi1,theta2,phi2)
// almost like the blue arc but with phi=10 degrees and different ends
draw(arc(O,r,20,10,70,10),black+linewidth(1pt),ArcArrow3);
// almost like the black arc but with phi=30 degrees
draw(arc(O,r,90,30,90,90),pink+linewidth(1pt),ArcArrow3);
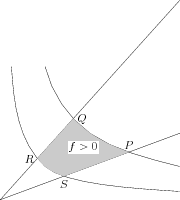
// buildcycle
// http://www.piprime.fr/985/official_asymptote_example-buildcycle/

/* This code comes from The Official Asymptote Gallery */

size(200);

real w=1.35;

path[] p;
for(int k=0; k < 2; ++k) {
  int i=2+2*k;
  int ii=i^2;
  p[k]=(w/ii,1){1,-ii}::(w/i,1/i)::(w,1/ii){ii,-1};
}

path q0=(0,0)--(w,0.5);
path q1=(0,0)--(w,1.5);
draw(q0); draw(p[0]); draw(q1); draw(p[1]);
path s=buildcycle(q0,p[0],q1,p[1]);
fill(s,mediumgrey);

label("$P$",intersectionpoint(p[0],q0),N);
label("$Q$",intersectionpoint(p[0],q1),E);
label("$R$",intersectionpoint(p[1],q1),W);
label("$S$",intersectionpoint(p[1],q0),S);
label("$f > 0$",0.5*(min(s)+max(s)),UnFill);
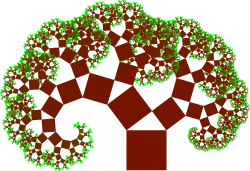
// Pythagorean tree
// http://www.piprime.fr/971/official_asymptote_example-PythagoreanTree/

/* This code comes from The Official Asymptote Gallery */

size(250);

real a=3;
real b=4;
real c=hypot(a,b);

transform ta=shift(c,c)*rotate(-aCos(a/c))*scale(a/c)*shift(-c);
transform tb=shift(0,c)*rotate(aCos(b/c))*scale(b/c);

picture Pythagorean(int n) {
  picture pic;
  fill(pic,scale(c)*unitsquare,1/(n+1)*green+n/(n+1)*brown);
  if(n == 0) return pic;
  picture branch=Pythagorean(--n);
  add(pic,ta*branch);
  add(pic,tb*branch);
  return pic;
}

add(Pythagorean(12));
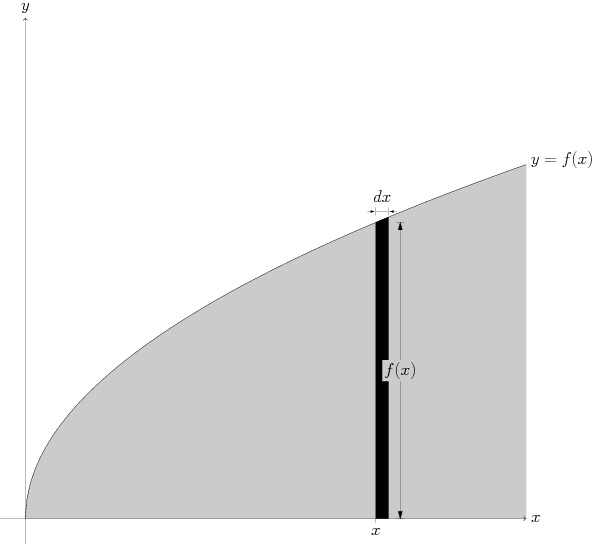
// intro calculus diagram from
// https://math.uchicago.edu/~cstaats/Charles_Staats_III/Notes_and_papers_files/asymptote_tutorial.pdf
// page 48

// Basic settings
size(21cm, 0);
defaultpen(fontsize(16pt));
import graph;
//Define the command drawshifted, to be used later
void drawshifted(path g, pair trueshift, picture pic =
currentpicture, Label label="", pen pen=currentpen,
arrowbar arrow=None, arrowbar bar=None, margin
margin=NoMargin, marker marker=nomarker)
{
pic.add(new void(frame f, transform t) {
picture opic;
draw(opic, L=label, shift(trueshift)*t*g, p=pen, arrow=arrow, bar=bar, margin=margin, marker=marker);
add(f,opic.fit());
});
pic.addBox(min(g), max(g), trueshift+min(pen), trueshift+max(pen));
}
//Save some important numbers.
real xmin = -0.1;
real xmax = 2;
real ymin = -0.1;
real ymax = 2;
//Draw the graph and fill the area under it.
real f(real x) { return sqrt(x); }
path s = graph(f, 0, 2, operator..);
pen fillpen = mediumgray;
fill(s -- (xmax,0) -- cycle, fillpen);
draw(s, L=Label("$y=f(x)$", position=EndPoint));
//Fill the strip of width dx
real x = 1.4;
real dx = .05;
real t0 = times(s,x)[0];
real t1 = times(s,x+dx)[0];
path striptop = subpath(s,t0,t1);
filldraw((x,0) -- striptop -- (x+dx,0) -- cycle, black);

//Draw the bars labeling the width dx
real barheight = f(x+dx);
pair barshifty = (0, 0.2cm);
Label dxlabel = Label("$dx$", position=MidPoint, align=2N);
drawshifted((x,barheight) -- (x+dx, barheight),
trueshift=barshifty, label=dxlabel, bar=Bars);
//Draw the arrows pointing inward toward the dx label
real myarrowlength = 0.3cm;
margin arrowmargin = DotMargin;
path leftarrow = shift(barshifty) * ((-myarrowlength, 0) -- (0,0));
path rightarrow = shift(barshifty) * ((myarrowlength, 0) -- (0,0));
draw((x, barheight), leftarrow, arrow=Arrow(), margin=arrowmargin);
draw((x+dx, barheight), rightarrow, arrow=Arrow(), margin=arrowmargin);
//Draw the bar labeling the height f(x)
real barx = x + dx;
pair barshiftx = (0.42cm, 0);
Label fxlabel = Label("$f(x)$", align=(0,0), position=MidPoint, filltype=Fill(fillpen));
drawshifted((barx,0) -- (barx, f(x)), trueshift=barshiftx, label=fxlabel, arrow=Arrows(), bar=Bars);
//Draw the axes on top of everything that has gone before
arrowbar axisarrow = Arrow(TeXHead);
Label xlabel = Label("$x$", position=EndPoint);
draw((xmin,0) -- (xmax,0), arrow=axisarrow, L=xlabel);
Label ylabel = Label("$y$", position=EndPoint);
draw((0,ymin) -- (0,ymax), arrow = axisarrow, L=ylabel);
//Draw the tick mark on the x-axis
path tick = (0,0) -- (0,-0.15cm);
Label ticklabel = Label("$x$", position=EndPoint);
draw((x,0), tick, L=ticklabel);