Homework Problems
Extra Exercise 1.4.9
The pier in Santa Monica, CA, is a popular destination for both tourists and locals. Visitors ride the Ferris wheel (F), eat ice cream (C), or just walk around on the pier(W). Write a dynamical model for the numbers of people engaged in these activities given the following assumptions. (Hint: Start by drawing a diagram of this system and labeling the stocks and flows.)
People entering the pier always start by just walking around.
E people enter the pier each minute.
Visitors leave at a constant per capita rate d. They can leave only when they are walking around.
Due to fear of nausea, people do not go directly from eating ice cream to riding the Ferris wheel.
Visitors prefer to go on the Ferris wheel with friends. Thus, the probability that any one individual will go on the Ferris wheel is proportional to the number of people walking around, with proportionality constant b.
Riders leave the Ferris wheel at per capita rate n.
When visitors leave the Ferris wheel, a fraction z of them go directly to eating ice cream. The others walk around.
Visitors who are walking around prefer to avoid long lines for ice cream. Thus, the per capita rate at which they get ice cream is proportional to the inverse of the number of people already doing so, with proportionality constant m.
People who are eating ice cream stop doing so at a constant per capita rate k.
Review Terminology

Review
List
Plot and List_plot

If we have our own x axis data

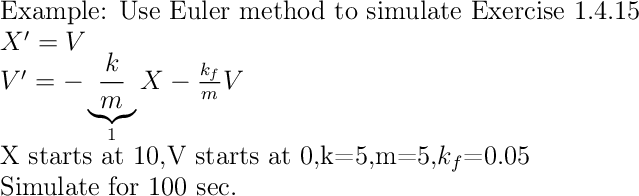
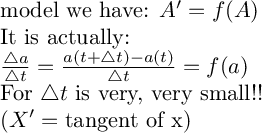
Euler's Method
What it is?

How to do this in SAGE?
We need:
Initial point
How it changes
Get:
Next point
(This is not the real code, it just illustrate the idea)
We have to simulate how x changes!!!
Only one time?
How to storage it?
Append it to a list!
Put comment in your code if it is more than 4 lines long!!