M = mandelbrot_plot(x_center=-.5)
M
500x500px 24-bit RGB image
type(M)
<class 'sage.repl.image.Image'>
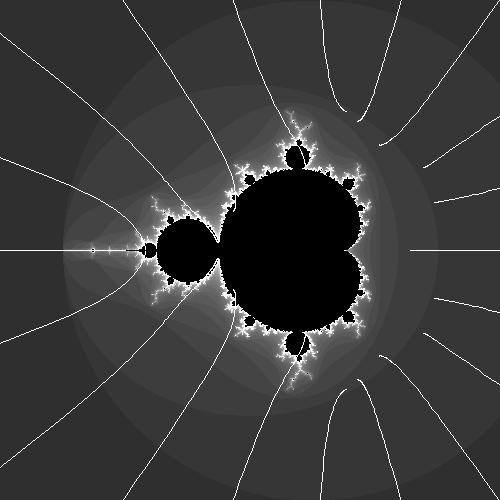
M = mandelbrot_plot(x_center=-.5)
M = external_ray([0,0.05,..1], image=M)
fn = 'mandelbrot.png'
M.save(fn)
salvus.file(fn)
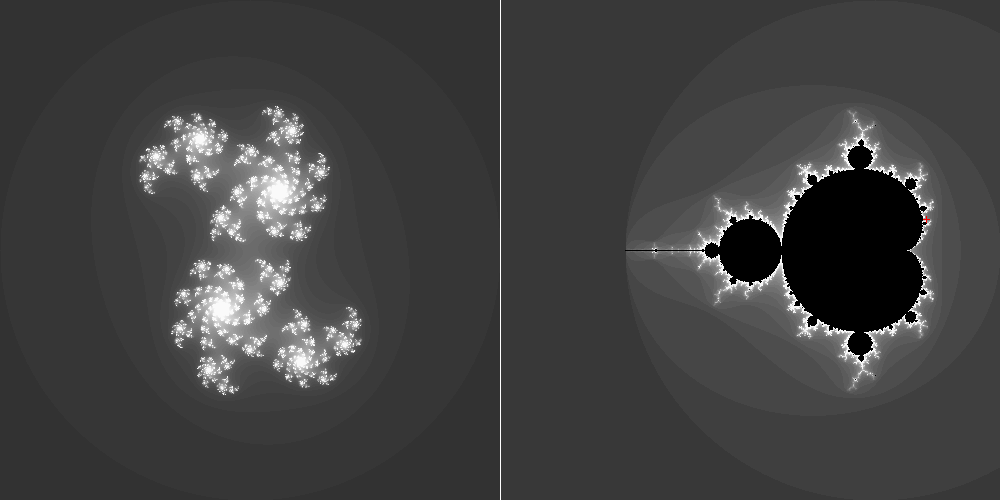
J = julia_plot(c = 0.4 + 0.25j)
fn = 'julia-fractal.png'
J.save(fn)
salvus.file(fn)
M?
File: /ext/sage/sage-8.1/local/lib/python2.7/site-packages/sage/repl/image.py
Docstring :
Creates a new image with the given mode and size.

INPUT:

* "mode" -- string. The mode to use for the new image. Valid
  options are:

     * "'1'" (1-bit pixels, black and white, stored with one
       pixel per byte)

     * "'L'" (8-bit pixels, black and white)

     * "'P'" (8-bit pixels, mapped to any other mode using a
       color palette)

     * "'RGB'" (3x8-bit pixels, true color)

     * "'RGBA'" (4x8-bit pixels, true color with transparency
       mask)

     * "'CMYK'" (4x8-bit pixels, color separation)

     * "'YCbCr'" (3x8-bit pixels, color video format)

     * "'LAB'" (3x8-bit pixels, the L*a*b color space)

     * "'HSV'" (3x8-bit pixels, Hue, Saturation, Value color
       space)

     * "'I'" (32-bit signed integer pixels)

     * "'F'" (32-bit floating point pixels)

* "size" -- 2-tuple, containing (width, height) in pixels.

* "color" -- string or tuple of numeric. What colour to use for
  the image. Default is black.  If given, this should be a a tuple
  with one value per band. When creating RGB images, you can also
  use colour strings as supported by the ImageColor module.  If the
  colour is None, the image is not initialised.

OUTPUT:

A new "Image" object.

EXAMPLES:

   sage: from sage.repl.image import Image
   sage: Image('P', (16, 16), (13,))
   16x16px 8-bit Color image
from sage.repl.image import Image
I = Image('P', (16, 16), (13,))
I
16x16px 8-bit Color image
I.save('sage-image.png')
salvus.file('sage-image.png')
