testing Gaston with Julia in CoCalc in a Sage worksheet
Gaston provides an interface to gnuplot from the Julia language system.
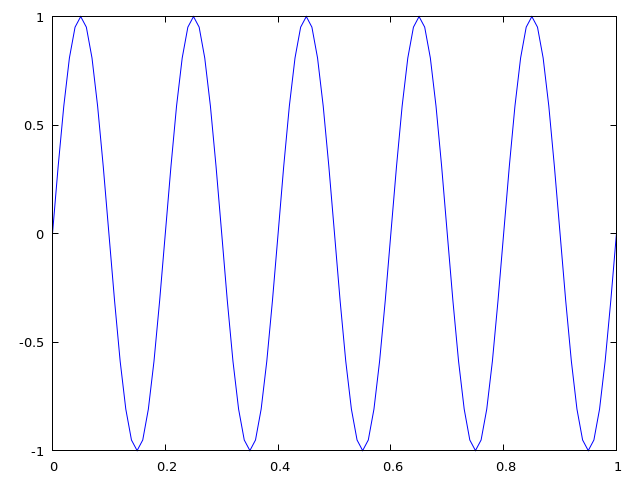
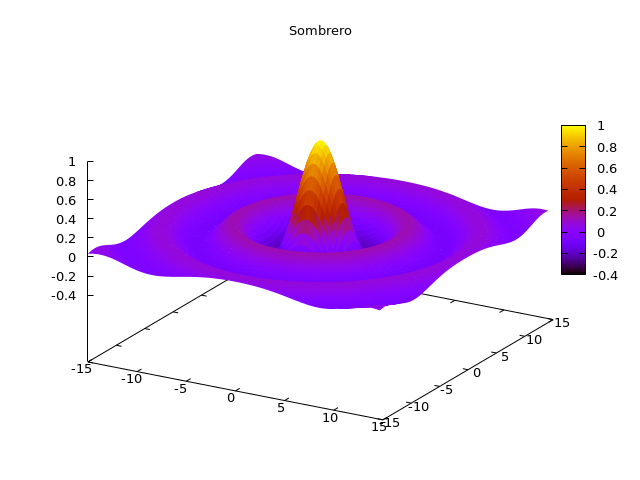
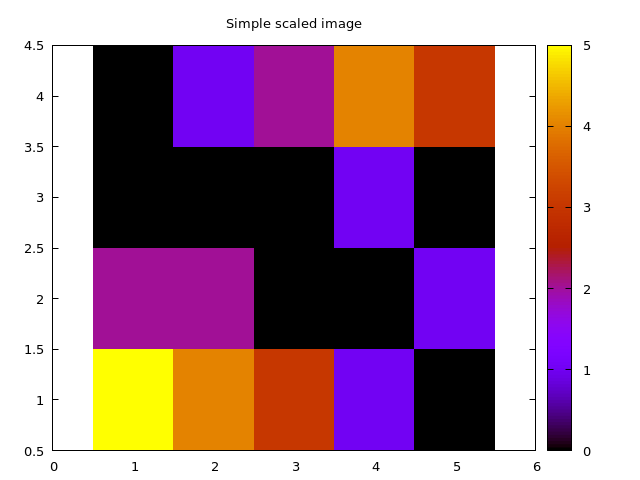
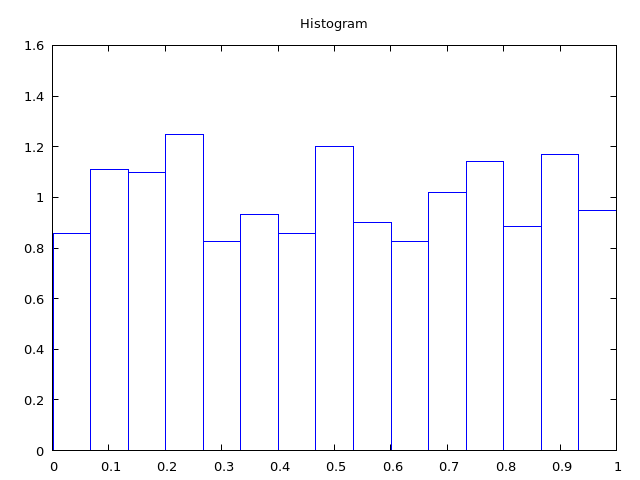
Selected examples from the excellent Gaston Tutorial
There is a Jupyter notebook version of this worksheet.
links
Julia Version 0.6.2
Commit d386e40c17 (2017-12-13 18:08 UTC)
Platform Info:
OS: Linux (x86_64-pc-linux-gnu)
CPU: Intel(R) Xeon(R) CPU @ 2.20GHz
WORD_SIZE: 64
BLAS: libopenblas (USE64BITINT DYNAMIC_ARCH NO_AFFINITY Haswell)
LAPACK: libopenblas64_
LIBM: libopenlibm
LLVM: libLLVM-3.9.1 (ORCJIT, broadwell)
1 required packages:
- Gaston 0.7.4
INFO: Package Gaston is already installed
gnuplot 5.0 patchlevel 3
1
1
1
1