
RPy2
RPy2 is a Python module for interacting with R from Python. It exposes functions, packages and more in Python and allows to reference them. Dots in R functions are automatically converted to underscores. Additionally, data conversions for various types can be enabled - first and foremost for NumPy arrays.
'2.8.5'
Referencing R functions
RPy2's robjects (or sometimes just imported as ro) exposes the R instance as .r. It is rather easy to get hold of functions and reference them from Python:
R object with classes: ('summaryDefault', 'table') mapped to:
<FloatVector - Python:0x7f506223f4d0 / R:0x634af40>
[-1.800000, 0.300000, 2.700000, 2.150000, 4.550000, 5.000000]
Min. 1st Qu. Median Mean 3rd Qu. Max.
-1.80 0.30 2.70 2.15 4.55 5.00
2.15
Evaluating R code directly
[1] "sd(zz) = 3.02765035409749"
<rpy2.rinterface.StrSexpVector - Python:0x7f506e5eac00 / R:0x5a8ceb8>
R object with classes: ('numeric',) mapped to:
<FloatVector - Python:0x7f506223fb48 / R:0x56db568>
[12.440484]
Vectorization
First, enable automatic conversion from NumPy arrays to R arrays. Then, even the custom function works out of the box.
Data Type: <type 'numpy.ndarray'>
Element Type: float64
Array Shape: (5,)
R object with classes: ('summaryDefault', 'table') mapped to:
<FloatVector - Python:0x7f506223fd40 / R:0x5bdd258>
[-5.500000, -1.000000, 2.200000, 0.940000, 4.000000, 5.000000]
R object with classes: ('array',) mapped to:
<Array - Python:0x7f506223fc20 / R:0x5b0df58>
[52.274453, 34.274453, 11.954453, 4.274453, 62.774453]
Types of Vectors
[ ] and [[ ]] are rx and rx2
[1] 1 2 3 4 5 6 7 8 9 10
1
[1] -99 2 3 4 5 6 7 8 9 10
[1] 99
[1] -99 2 99 4 5 6 7 8 9 10
$aa
[1] 1 2 3
$bb
[1] -5 5
$cc
[1] "help"
[1] 1 2 3
[1] 2
2.0
$aa
[1] 1 2 3
$bb
[1] -5 5
$cc
[1] "help"
[1] "this" "is" "a" "short" "sentence"
[,1] [,2]
[1,] 0 5
[2,] 1 6
[3,] 2 7
[4,] 3 8
[5,] 4 9
<class 'rpy2.robjects.vectors.Matrix'>
R object with classes: ('integer',) mapped to:
<IntVector - Python:0x7f506224acf8 / R:0x60528c8>
[ 8]
[,1] [,2]
[1,] FALSE FALSE
[2,] FALSE TRUE
[3,] FALSE TRUE
[4,] FALSE TRUE
[5,] FALSE TRUE
[[1]]
[1] 4
[[2]]
[1] 5
[[3]]
[1] 6
[1] x y y y x y z y z y x x
Levels: x y z
x y z
4 6 2
Packages
The idea is to get hold of a reference to a package. The reference is like a module-namespace and populated with all the members.
['upper_tri', 'url', 'utf8ToInt', 'vapply', 'vector', 'version', 'warning', 'warnings', 'weekdays', 'weekdays_Date']
_
platform x86_64-pc-linux-gnu
arch x86_64
os linux-gnu
system x86_64, linux-gnu
status Revised
major 3
minor 2.4
year 2016
month 03
day 16
svn rev 70336
language R
version.string R version 3.2.4 Revised (2016-03-16 r70336)
nickname Very Secure Dishes
[,1] [,2]
[1,] 10 12
[2,] 46 54
R object with classes: ('character',) mapped to:
<StrVector - Python:0x7f5061ddff80 / R:0x65295e0>
[str, str, str, ..., str, str, str]
<class 'rpy2.robjects.vectors.DataFrame'>
2
['numeric', 'numeric']
eruptions waiting
2 1.800 54
3 3.333 74
4 2.283 62
10 4.350 85
[1] 3.600 1.800 3.333 2.283 4.533 2.883 4.700 3.600 1.950 4.350
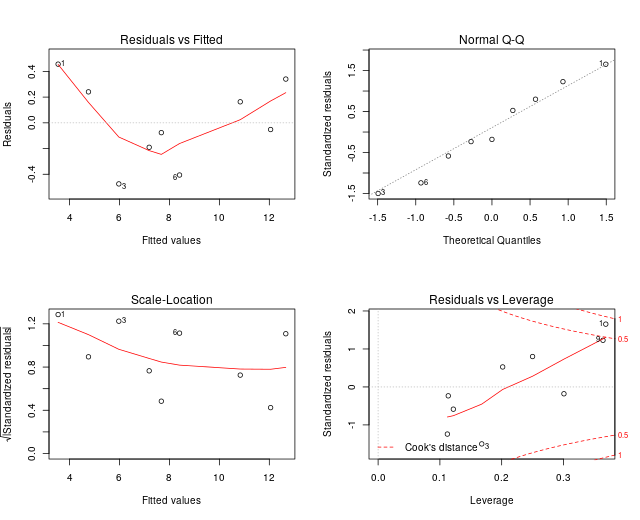
Example: lm
[1] "coefficients" "residuals" "effects" "rank"
[5] "fitted.values" "assign" "qr" "df.residual"
[9] "xlevels" "call" "terms" "model"
R's representation via 'print'
(Intercept) x
2.328485 1.215469
Same coefficients in Python's floats:
[2.3284853249475894, 1.2154692791485244]
0.456045395904
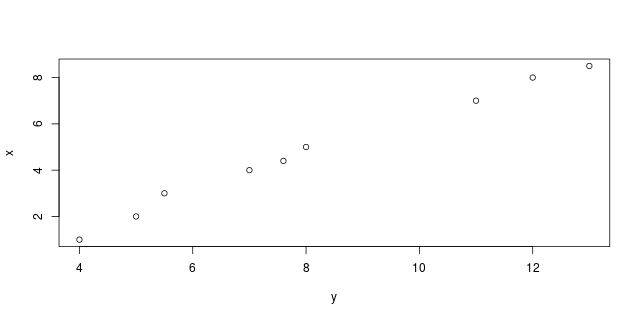
Plot
R object with classes: ('integer',) mapped to:
<IntVector - Python:0x7f5061dfb830 / R:0x75524b8>
[ 1]
R object with classes: ('integer',) mapped to:
<IntVector - Python:0x7f5061ec8878 / R:0x78dad28>
[ 1]
R object with classes: ('integer',) mapped to:
<IntVector - Python:0x7f5061ebcd40 / R:0x83f4d78>
[ 1]
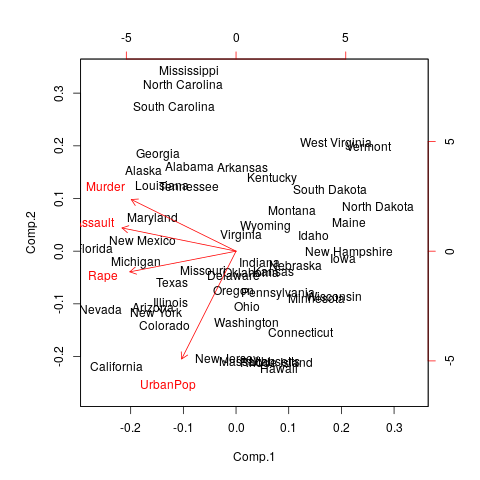
Advanced: PCA
Importance of components:
Comp.1 Comp.2 Comp.3 Comp.4
Standard deviation 1.5748783 0.9948694 0.5971291 0.41644938
Proportion of Variance 0.6200604 0.2474413 0.0891408 0.04335752
Cumulative Proportion 0.6200604 0.8675017 0.9566425 1.00000000
R Help on ‘sum’sum                    package:base                    R Documentation

Sum of Vector Elements

Description:

     ‘sum’ returns the sum of all the values present in its arguments.

Usage:

     sum(..., na.rm = FALSE)

Arguments:

     ...: numeric or complex or logical vectors.

   na.rm: logical.  Should missing values (including ‘NaN’) be removed?

Details:

     This is a generic function: methods can be defined for it directly
     or via the ‘Summary’ group generic.  For this to work properly,
     the arguments ‘...’ should be unnamed, and dispatch is on the
     first argument.

     If ‘na.rm’ is ‘FALSE’ an ‘NA’ or ‘NaN’ value in any of the
     arguments will cause a value of ‘NA’ or ‘NaN’ to be returned,
     otherwise ‘NA’ and ‘NaN’ values are ignored.

     Logical true values are regarded as one, false values as zero.
     For historical reasons, ‘NULL’ is accepted and treated as if it
     were ‘integer(0)’.

     Loss of accuracy can occur when summing values of different signs:
     this can even occur for sufficiently long integer inputs if the
     partial sums would cause integer overflow.  Where possible
     extended-precision accumulators are used, but this is
     platform-dependent.

Value:

     The sum. If all of ‘...’ are of type integer or logical, then the
     sum is integer, and in that case the result will be ‘NA’ (with a
     warning) if integer overflow occurs.  Otherwise it is a length-one
     numeric or complex vector.

     *NB:* the sum of an empty set is zero, by definition.

S4 methods:

     This is part of the S4 ‘Summary’ group generic.  Methods for it
     must use the signature ‘x, ..., na.rm’.

     ‘plotmath’ for the use of ‘sum’ in plot annotation.

References:

     Becker, R. A., Chambers, J. M. and Wilks, A. R. (1988) _The New S
     Language_.  Wadsworth & Brooks/Cole.

See Also:

     ‘colSums’ for row and column sums.

Examples:

     ## Pass a vector to sum, and it will add the elements together.
     sum(1:5)

     ## Pass several numbers to sum, and it also adds the elements.
     sum(1, 2, 3, 4, 5)

     ## In fact, you can pass vectors into several arguments, and everything gets added.
     sum(1:2, 3:5)

     ## If there are missing values, the sum is unknown, i.e., also missing, ....
     sum(1:5, NA)
     ## ... unless  we exclude missing values explicitly:
     sum(1:5, NA, na.rm = TRUE)
Sum of Vector Elements
\code{sum} returns the sum of all the values
present in its arguments.
sum(\dots, na.rm = FALSE)
... : numeric or complex or logical vectors.
na.rm : logical. Should missing values (including \code{NaN}) be
removed?
\code{\link{colSums}} for row and column sums.
The sum. If all of \code{\dots} are of type integer or logical, then
the sum is integer, and in that case the result will be \code{NA} (with a
warning) if integer overflow occurs. Otherwise it is a length-one
numeric or complex vector.
\strong{NB:} the sum of an empty set is zero, by definition.
('title', 'name', 'alias', 'keyword', 'description', 'usage', 'arguments', 'details', 'value', 'section', 'references', 'seealso', 'examples')
title
-----
Sum of Vector Elements
usage
-----
sum( , na.rm = FALSE)
details
-------
This is a generic function: methods can be defined for it
directly or via the Summary group generic.
For this to work properly, the arguments should be
unnamed, and dispatch is on the first argument.
If na.rm is FALSE an NA or NaN value in
any of the arguments will cause a value of NA or NaN to
be returned, otherwise NA and NaN values are ignored.
Logical true values are regarded as one, false values as zero.
For historical reasons, NULL is accepted and treated as if it
were integer(0) .
Loss of accuracy can occur when summing values of different signs:
this can even occur for sufficiently long integer inputs if the
partial sums would cause integer overflow. Where possible
extended-precision accumulators are used, but this is
platform-dependent.
references
----------
Becker, R. A., Chambers, J. M. and Wilks, A. R. (1988)
The New S Language .
Wadsworth & Brooks/Cole.
section
-------
S4 methods
This is part of the S4 Summary
group generic. Methods for it must use the signature
x, , na.rm .
plotmath for the use of sum in plot annotation.